GE-Tools Home
GE-PATH / GE-GRAPH
Updated January
2007
| Comments/Questions/Suggestions/Bug
Reports
(to add a comment send email) Date:
Sat, 4 Feb 2006 11:05:24 EST
Good Morning Sgrillo! I saw your posting on the Google Earth Hacks bulletin board - WOW! What a fascinating thing GE Path is. I look forward to playing with it a lot, and thank you very much for posting the link on the GEH BB. Wow oh wow oh wow! Jim S. |
Answers
|
|
Date:
Sun, 5 Mar 2006 02:31:35 -0000
Excellent tool well done. I'm finding GEPath very helpful. Would it be possible to add the option of having *filled* circles for each point and give it a transparency a text box also?Many thanks and keep up the excellent tool, it's great! Cheers
|
Date:
Sun, 05 Mar 2006 07:44:24 -0300
Hi
Marty,
Cheers Ricardo Sgrillo |
|
Date:
Wed, 22 Mar 2006 22:07:48 -0500
To whom it may concern, I posted a response to your posting on the GEarth bbs here. Can you take a look at the CAB file? Also, I had some problems with the Help File. I could not get anything to appear on the right. The contents bar and search function worked, but I just couldn't display the information. Here is the text of my response: rsgrillo, This utility is a MUST HAVE and looks outstanding. Hopefully, I will get to use this program often. However, when I tried to start the program, I got the following error message: Failed to load control 'ecGrid' from ecGrid.ocx. Your version of ecGrid.ocx may be outdated. Make sure you are using the version of the control that was provided with your application. I looked
at the properties for the file ecGrid.ocx, and I found this:
Can you provide any help? I am using Windows XP Pro. Thanks. |
Date:
Thu, 23 Mar 2006 09:14:52 -0300
Hi Jim, Tanks for your email. I have posted in bbs.keyhole the answer below (ocx bug) It
seems that, for some reason, the application installer did not register
the ocx control in your system.
regsvr32 <control path & name> For
example if the control is in WINDOWS\system32 folder you shall type:
|
|
Date:
Thu, 23 Mar 2006 22:51:00 -0500
Ricardo
Sgrillo, I posted a response. Thanks for helping me out. Once
I used the EMSA DLL register tool, everything worked, including the Help
file. By the way, I did not have this problem for the GE Path tool.
|
|
|
To:
sgrillo@cepec.gov.br
Hello Ricardi, I try
to use your GE Graph utilitity to display in GE some bathymetric data.
"Error9 (subscript out of range) in procedure faZ of Formulario Form1." Enclosed my text file. Many thanks for your assistance. Best regards. Peio
E.
|
Date:
19 Apr 2006 11:49:59 -0300
You
are right. The present version of GE-Graph has size limitations on the
input and on the processed
The input file must have less then 5,000 placemarks/way points. The processed file (output) must have less then 100,000 lines of kml code. The file you sent has more then 10,000 points. The effective size of the files the application can handle depends on the ratio placemark/kml lines generated that is a function of the options you have choose. This ratio varies from 20 kml lines by each placemark (bar graph with no labels) to more then 50 kml lines by placemark (circles/squares with labels). This restriction shall be removed in the next versions of GE-Graph. The suggestion I can give you is to split your file in three or four parts and then run each one in a separate process. Then you show all together in GE. You have keep the minimum and maximum values repeated in each file, so your scale will remain constant for each file part. R.Sgrillo |
|
To:
<sgrillo@cepec.gov.br>
Hi, I´m Matthias from Germany and have downloaded your tools which is really great!!! However, could you please check or advise on the area calculations...? The calculated circumference is always right - a square of 100m X 100m in google earth gives 0,4 km -> this right.The calculated area is wrong - it gives me approximate 3,5 ha, but should be 1 ha. If I generate a square of 1km everything is fine -> circumference is 4 km and the area is 100 ha. I believe that also the square meters are calculated wrong in the 1st sample. What is going wrong or do I think wrong...? With best regards from Germany, Matthias |
Subject:
Re: GE-Path Version 1.3
Hi Matthias, Thank
you for your email. You are right. There is a bug in small area calculation.
This may be
The
number of decimals used in the calculations,
I am trying to find out. By
now I would advise you to do not trust in the results of small area results.
I will try to fix
Greetings from Brazil Ricardo Sgrillo |
|
Date:
Sat, 22 Apr 2006 17:12:20 +0200
Hi Ricardo, I'm
the user Southernman from the german GE Community. Just found your email-addy
on your webpage. In the attached files I send you the KLM file and screenshoots
from the settings and results of the two versions of GE-Path. I hope, this
helps a little bit more for finding out, what causes this strange
Thank you for this fine tool. After finding this program I decided to start my project, which is about some verry old streets of the roman Imperium here at Bavaria from 2000 years ago. One of them is called today Via Julia and I'll still need a lot of time of recherching for finding all the remainig traces, which left until today. Greetings
from Munich, Germany to Brazil,
|
Date:
Sat, 22 Apr 2006 11:20:35 -0300
Hi Southernman, I think I have found the problem. Both versions of GE-Path are dependent of your locale settings concerning the decimal separator symbol. They will work correctly only if your computer is configured to use dot as decimal separator. However it is most likely that the previous version will show problems only if you choose to draw circles or grids, while the new version (because of the data grid) will also show problems in paths. I configured my computer for comma and got the same strange path that you have posted in the forum (file VIA_JULIA_V2-Path_comma_1_3_0.kml). The version 1.2.3 draw right paths with comma (in this case-no guarantee) (file VIA_JULIA_V2-Path_comma_1_2_03.kml). Then I configured my computer for dot and the new version draws the right paths (file VIA_JULIA_V2-Path_dot_1_3_0) (Note that the file generated by the new version is much smaller than the old one). I know that this is inconvenient but it is a restriction of the language I used to develop the applications (Brazil, where I live, also use comma as decimal separator). I will try to remove this restriction in a future version. I will be glad if you could try the new version again. If you confirm my thoughts it will be nice if you could post a note on this matter, then the other people will be aware also. Best Regards Ricardo Sgrillo |
|
Date:
Sun, 23 Apr 2006 21:15:09 +0200
Hi Ricardo, you
found the solution. The comma is the separator in Germany too.
Thanks
and greetings,
|
|
|
To:
<sgrillo@cepec.gov.br>
Thanks
for the FREE path tool. May I humbly suggest that you add altitude
Chris |
Subject:
Re: GE-Path
Hi Chris Thank you for your email. Yes, this is a good suggestion. I am writing it in the list of bugs to fix/new features for the next version. Greetings from Brazil Ricardo Sgrillo |
|
On Sat, 22 Apr 2006 19:53:32 -0300 Dear Ricardo, thank
you for your reply,
Hope
that you will find the time to get the small bug(s) fixed some day,
I made
some messurements (bigger size) for my friend Buddy, and this
What
I was also wondering is that at bigger size distances, meters are
Keep up the great work, with best regards Matthias,
from My Home.kml
|
Date:
Sat, 22 Apr 2006 23:18:26 -0300
Mathias, We have a problem, because I was unable to reproduce the meter error here, with the kml file you have sent. I also can't imagine any local configuration settings that could cause this behavior. Is the perimeter wrong also in GE folders? (see small image) Please, uncheck "open in GE", run the GE-Path and click in cancel in the save dialog. Then change the distance unit in the combo box. What happen with the perimeter? Is it wrong only for meter? Best regards Ricardo |
|
To:
"'Ricardo Sgrillo'" <sgrillo@cepec.gov.br>
Dear Ricardo, as it worked for you, but not for me, I investigated by myself. I changed
now in my "Windows XP Professional - German" Regional Settings
When
I worked with the dot before and tried to open the kml-file in GE,
With kind regards, Matthias By
the way, I read your RESUMÉ. My respect! I´m wondering that
you find
|
Date:
Sun, 23 Apr 2006 08:39:46 -0300
Matthias, I thought on "decimal separator", but, as you already were using the dot, I forgot it and did not think on" digit aggregation" symbol. Well, it seems that the application is running ok now (at least for larger distances). Hope you can enjoy it. Don't hesitate to contact me if you have any other problem or suggestion. <
I´m wondering that you find the team to follow up this kind of requests.
Well, I can always take apart a couple of hours at the evenings and weekends. It is important to get bugs identification and suggestions from the users. I intend to release yet one or two improved versions for the applications. Regards Ricardo |
|
To:
sgrillo@cepec.gov.br
Hi SGRILLO, I tryied GE-Graph its great thanks . I will like to ask if tere is a way of showing for your frinds where you har via the internet? Say I have a mobile phone a gps is there a software that makes you visible to other in the internet? I have
used MeHere http://mehere.glenmurphy.com/ ,But you can´t show your
friends where you are. Not if
Mais uma vez muito obrigado pelo exelente trabalho com GE-GRAPH Helio |
Date:
Thu, 11 May 2006 21:55:10 -0300
Oi Helio, Desculpe, mas, por problemas diversos, só hoje consegui ler seu email. Fico feliz que voce tenha gostado do programa. Acho que não posso ajuda-lo na sua duvida, pois não tenho experiencia com aplicações para internet. Talvez voce possa obter ajuda no forum do Google Earth http://bbs.keyhole.com/ubb/ubbthreads.php/Cat/0) Um abraço Ricardo Sgrillo |
|
Date:
Wed, 10 May 2006 09:10:28 -0700
Hello, Do
you know if it possible to use GE-Graph to make bar graphs on the
Thanks,
|
From:
Ricardo Sgrillo [mailto:sgrillo@cepec.gov.br]
Hi Brian, I am
afraid no. It would be necessary to include a procedure to process
May be in the next version. Regards Ricardo
Sgrillo
|
|
To: <sgrillo@cepec.gov.br> Subject: GE graph Date: Fri, 12 May 2006 15:12:54 +0300 Mr. Ricardo; When I am setting my computer to GE graph ,I am getting an error message as follows. Can you help me please? Thanks a lot. error message: C.//System32/scrrundll
Mustafa |
Date: Fri, 12 May 2006 10:55:48 -0300 Subject: Re: GE graph From: "Ricardo Sgrillo" <sgrillo@cepec.gov.br> Organization: CEPLAC/CEPEC Hi Mustafa, This is the first report of this error. It seems it is linked to the Microsoft script library (scrrun.dll). GE-Graph uses this library to create and delete temporary folders, needed to generate kmz files. Lets try to findout what is happening. What is exectly the error message? When do you receive the error message? - when you try to install GE-Graph
Is there a file named "scrrun.dll" in your "system32" directory ? (you will have to set the Windows Explorer to show system and hidden file) What is the file verion ? (if you have it) - right click in the file and open the context menu. then click in "proprieties", "version" tab and "product version") I hope that with your information I can identify and fix the bug. R.Sgrillo |
|
To:
<sgrillo@cepec.gov.br>
Gracias por sus programas: son estupendos. Tuve algún problema con los separadores de decimales (la configuración regional en español usa . para millares y , para decimales). Un saludo, |
Date:
Sat, 13 May 2006 07:53:16 -0300
Ola Angel, Gracias por tu email. La proxima version, que estara disponible en pocas semanas, ofrece la opcion de hacer automatica la configuracion del separador decimal , volviendo a la configuracion original al encerrar el programa. Saludos Ricardo Sgrillo |
|
To:
sgrillo@cepec.gov.br
Hello, I have a .kml file of about 140 cities in GE Free. I can read the .kml fine with GE. Unfortunately, that same file shows only 14 cities in GE-Path. How do I fix this? abedit |
Subject:
Re: GE Path
Hi abedit First
time I receive a report of this kind. GE-Path will load, show and process
more the 4000 places.
R.
Sgrillo
|
|
To: <sgrillo@cepec.gov.br> Subject: Following a path Date: Thu, 25 May 2006 00:16:11 +0200 Dear Sgrillo, at first thank you for your very helpful tool and sorry for my bad English. Now my little problem. I'm using the latest version
of GE and GE-Path
But when I'm flying, the path, the view-direction
doesn't change. In
The solution that I want to have is that "path-flights"
are exactly to the
I tried several GE parameters and snapshot-views
but in view to the
What also can be the problem? I hope you can give
me help to find a
Thank you very much for your very useful programs
and also for your answer
Have a nice day and with best wishes from Germany! Marcel |
Date: Thu, 25 May 2006 12:08:39 -0300 Subject: Re: GE-Path From: "Ricardo Sgrillo" <sgrillo@cepec.gov.br> Hi Marcel, It seems that the problem is with Google Earth.
The path file generated by GE-Path is practicaly
Did you try to change the configuration in menu Tools/Options Control tab and checking Advanced? I have found several observations, similar to
yours, about following a path and tours in GE Free and
Take a look in the following topics of the GE Comunity. One
, Two
, Three,
Four
, Five
Greetings from Ilheus, Brazil Ricardo Sgrillo
|
|
On Tue, 06 Jun 2006 15:29:46 -0300, Adams ... wrote: When using GE Path to create polygons around points,
I'm getting
Ken
|
From: Ricardo Sgrillo [mailto:sgrillo@cepec.gov.br] Sent: Tuesday, June 06, 2006 2:38 PM Subject: Re: GE Path 1.4 error Hi Ken, Could you send me the original .kml file? I will
try to reproduce the
Regards Ricardo Sgrillo
Thank you very much. You have found a bug. It is interesting because it occurs only in few specific lat-lon combinations. I have fixed it (I hope). I am attaching the (new) GE-Path1_4_1.exe (zipped). It is not necessary to install it again. Just extract it to the ge-path folder. It is not necessary to delete your current version (1.4.0). However you should delete it after testing this new version. Don't forget to update your shortcuts. Could you please send me a feedback after testing
it?
Regards Ricardo |
|
To: <sgrillo@cepec.gov.br> Date12 Jun 2006 21:28:31.0343 (UTC) Subject: error 13 I'm getting an "error 13 (type mismatch) in procedure
faZ..."
Thanks, Quinton
|
Subject: Re: error 13 Date: Mon, 12 Jun 2006 20:04:19 -0300 From: "Ricardo Sgrillo" <sgrillo@cepec.gov.br> Organization: CEPLAC/CEPEC Hi Quinton, This error is generated by wrong type of data
assigned to a variable (ex:
If you can send me the original data I can try
to reproduce the error here
Regards
Ricardo Sgrillo |
|
Date: Mon, 17 Jun 2006 01:59:06 +0200 To: "sgrillo@cepec.gov.br" <sgrillo@cepec.gov.br> Subject: Ge-Graph Thank you for Ge-Path, and Ge-Graph,
But I have problem with Ge-Graph... On my system (Windows 2000, GeGraph v2.1.1), it
seems to export color with
<PolyStyle>
So all the squares are grey...
Thank you
|
Subject: Re: Ge-Graph Date: Sun, 18 Jun 2006 21:30:50 -0300 From: "Ricardo Sgrillo" <sgrillo@cepec.gov.br> Organization: CEPLAC/CEPEC Hi Arnaud, Thank you for your email. You are right. This
is a bug. I only discover
Thank you again Ricardo Sgrillo |
|
From Javier PY (GE Community) I can't make GEPATH 1.4.1 to work, it gives an
error dialog box that says:
Any ideas?
ps: thanks rsgrillo for those excellent programs. |
(
GE Community) Hi Javier_py, This version of GE-Path uses a library with a set of controls, called FM20.dll. The developers are not allowed to distribute this .dll with their applications. In most of the computers this file is installed with Microsoft Office. I advise you to go to Microsoft site in this page and just download and instal the Microsoft ActiveX Control Pad (free). This should fix the installation of FM20.dll and GE-Path shall then work well. Please, feedback Sgrillo |
|
Date: Fri, 23 Jun 2006 09:00:36 +0800 From: xP01nt To: sgrillo@cepec.gov.br Subject: can you give me some suggest GEPath is a Great tool for google earth, very useful. but i have a problem: when i convert a KML include Chinese Places Name, Google Earth Call error. i use text edit open KML file wrong code was found near Place name. can you give me some suggest ? Thanks.
x.p.o.i.n.t.
From: xP01nt
hey: I edit place name in GE-Path or other text editor now. thank for GE-Path that's great, and thank for
your help, and so glade
|
Date: Fri, 23 Jun 2006 20:08:06 -0300 To: xP01nt Subject: GE-Path From: "Ricardo Sgrillo" <sgrillo@cepec.gov.br> Organization: CEPLAC/CEPEC Hi, Unfortunaly I was not able to reproduce the error
here. The pictures you
When I tried here, with the kml file you have
sent, all the names appears,
You can try to open the file and type directly
in GE-Path's table the
Please note that the current version of GE-Path
and GE-Graph have no
Regards Ricardo Sgrillo |
|
Date: Mon, 26 Jun 2006 10:29:28 -0400 From: "Esin S" To: sgrillo@cepec.gov.br Subject: GE Path Thanks for making such a useful tool. As a suggestion
maybe you can add an
|
Date: Mon, 26 Jun 2006 11:51:47 -0300 To: "Esin S" <eseitomer@gmail.com> Subject: Re: GE Path From: "Ricardo Sgrillo" <sgrillo@cepec.gov.br> Hi Esin, Thank you for your email. I keep a list of suggestions,
bugs and comments
Greetings from Bahia Ricardo Sgrillo |
|
Sat 24 Jun 2006 20:30:31 GMT From: iglw4 To: sgrillo@cepec.gov.br Caro Ricardo Fiquei muito contente ao ver um brasileiro gerando
soluções para pessoas
A minha dúvida é como poderia criar
path no Google Free, p.q. ele avisa
A minha dúvida seria essa ... Muito Obrigado por hora Ivo
------------------------------------------- From: iglw4
Ricardo Muito Obrigado pela resposta e pela explicação
parabéns pela excelente
Abraço Ivo
|
From: "Ricardo Sgrillo" <sgrillo@cepec.gov.br> To: "Ivo " <iglw4> Subject: Re: Informação GE Path Date: Sun, 25 Jun 2006 11:29:20 -0300 Oi Ivo, Obrigado por seu email. GE-Path foi desenvolvido
justamente porque a GE
Um abraço R.Sgrillo |
|
Date: Wed, 28 Jun 2006 14:23:14 +0800 From: "steeven" To: sgrillo@cepec.gov.br Subject: bug report the attached file was loaded correct, but the output is bad-encoded it seemed that the chinese chars is bad encoded. btw, I made a online translation web page for
kml:
regards,
|
On 6/28/06, Ricardo Sgrillo <sgrillo@cepec.gov.br> wrote: Hi Steeven, Thank you for your email. < the attached file was loaded correct, but
the output is bad-encoded.
Well, GE-Path/Graph were developed in VB6 and
VB is an ASC based language.
but it is only working for Latin characters. I
think that this might be
I shall go deeply in this matter and try to fix
the programs.
< I made a online translation web page for
kml:
I tried your page. I entered a file path in clicked
in convert to path. It
I suggest putting on option to save OR to open
the generated file. I think
< we can exchange links :) Sure. I will be glad. Just tell me what name do
you want for the link.
Greetings from Brazil Ricardo |
|
Subject: Error 9 (subscript out of range) in procedure Carraga Poligono in Form Main. Date: Thu, 29 Jun 2006 08:56:31 +1100 From: "Scott" <ScottP> To: <sgrillo@cepec.gov.br> Hello I have been having a look at GEGraph. I have a kml file that I have tried to open and I get an error message. Error 9 (subscript out of range) in procedure Carraga Poligono in Form Main. This may be because of the way my kml file is setup. It however does open in GE Any help would be fantastic Many thanks Scott GIS Programmer--
I am still having a few issues but I am really just hacking around. The kml file is attached with the coordinates of my polygons but I created this from a shape file and used a application called arc2GE to translate. Perhaps the format is not the same. I removed the carriage return. Any help would again be most appreciated. Scott ------------- From: "Scott" <ScottPt>
Thanks very much for your help Ricardo. I realize what I missed out doing. This is really interesting as an output. Things are working well and I am looking at other ways of showing some data in this fashion, because people here in the pacific don't have much idea of GIS and this is one way to show them. Once again many thanks for your help with this Scott
|
From: Ricardo Sgrillo [mailto:sgrillo@cepec.gov.br] Sent: Thursday, June 29, 2006 9:45 AM To: Scott Subject: Re: Error 9 (subscript out of range) in procedure Carraga Poligono in Form Main. Hi Scott This error says that the number of lines of the
file is too large. The
Well, to give you a precise help I would have
to look at your file or at
Regards Ricardo Sgrillo
Hi Scott, I am sending two edited original files and two processed file. You need, at least, one <name>polygon_name</name>
after the first
I edited your original file and put de name a1
for the first placemark
I edit again your file a put one name (a1,a2,a3,..)
for each placemark
You can have any number of polygons under one
name and all will be
Note that you have always to work with the original
files. If you try to
Please feed back and tell me if the things are working well, now. Regards Ricardo |
|
Date: Fri, 07 Jul 2006 12:37:02 -0400 From: Gary To: sgrillo@cepec.gov.br Subject: GePath 1.4.1 wants fm20.dll I even have the runtime library installed.
What can I do to get GE-Path 1.4.1 working, so
I can use GE4, or will I
|
Date: Fri, 07 Jul 2006 13:49:19 -0300 To: "Gary Subject: Re: GePath 1.4.1 wants fm20.dll From: "Ricardo Sgrillo" <sgrillo@cepec.gov.br> Hi Gary, No, you don't have to reinstall the older version.
Greetings Ricardo Sgrillo |
|
From: "Rich To: <ricardo.sgrillo@terra.com.br> Subject: GE Graph Date: Fri, 14 Jul 2006 10:01:53 -0600 Good morning, I just downloaded GE Graph. I am working
with ArcGIS.so converting shp
I don't know if you support this data, but I could
really use your help.
Suggestions?
Thanks for putting this together.once I get it
working I hope to incorporate
Rich |
From: "Ricardo Sgrillo" <sgrillo@cepec.gov.br> To: "Rich Subject: Re: GE Graph Date: Fri, 14 Jul 2006 16:22:21 -0300 Hi Rich, Thank you for your email. This error msg may be
generated by different
The figure D was generated using as input the
file brazil_borders.zip
If you look at the txt file its format will be
evident. Both file will
For kml formated files, one of the most common
error is the use of file
If you have only one name, every individual polygon
below will be
If you have one name for each polygon then each
polygon will be considered
You can have any number of polygons under each <name> tag. Another common factor of this error msg could
be the use of symbol
Note that, in the txt file, the first line after
each group of coordinates
Please feed back and tell me if the things are
working well, now. If not
Greetings Ricardo Sgrillo
|
|
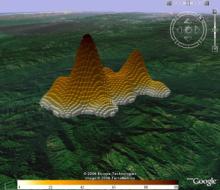
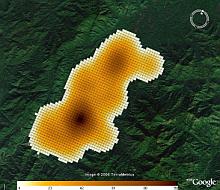
From: "Peter To: <sgrillo@cepec.gov.br> Subject: problem with grid generation Date: Sat, 15 Jul 2006 12:06:54 -0400 Hello Ricardo, First off, thanks for the great tool! I have gotten a lot out of it. Currently, I am trying to create a grid but not getting any color in the grid cells. I have attached the text file I am using along with a screenshot of the GEGraph interface with the values I am using. I hope you may be able to offer some advice. Thanks in advance for your help.
Sincerely, Pete Cutter |
From: "Ricardo Sgrillo" <sgrillo@cepec.gov.br> To: "Peter Subject: Re: problem with grid generation Date: Sat, 15 Jul 2006 18:44:36 -0300 Hi Peter, Thank you for the email. I have tested your file
here and it presented the
However there is a workaround. If you locate the
flat graph in a small
To do this you have, first, to update to the latest
version (2.2.0) of
Now you can choose between 3d graph and flat graph.
In 3d graphs the
I am attaching two images of your data. Please feedback and don't hesitate to contact
me if you need further
Greetings Ricardo Sgrillo
|
|
From:Flavio To: sgrillo@cepec.gov.br Subject: GEPath Fiz download do GEPATH 1.4.0 tenho o Google Earth 4 instalei as bibiotecas do VB6 mas quando clico no ícone do GEPath apresenta a mensagem: ---------------------------
Já testei em dois computadores. Sendo que
num deles tem Google Earth Plus
Flávio Junior |
Ricardo Sgrillo wrote: Oi Flavio, O GE-Path usa uma biblioteca chamada fm20.dll da Microsoft que os desenvolvedores não tem permissão para distribuir nos seus> instaladores. Na maioria dos computadores esta biblioteca é normalmente instalada quando se instala o Office. Em alguns computadores, no entanto (não sei porque) este erro pode ser apresentado. Para resolver o problema va no site da Microsoft (http://msdn.microsoft.com/library/default.asp?url=/library/en-us/dnaxctrl/html/cpad.asp) baixe e instale o Microsoft ActiveX Control Pad (gratis). Isto deve arrumar a instalação da fm20.dll. O GE-Path deve funcionar então sem problemas. Não é necessario re-instalar. Avise, por favor, se resolveu (ou não) o problema. Um abraço Ricardo Sgrillo complementando: veja esta mensagem no forum
do Google Earth (http://bbs.keyhole.com/ubb/showthreaded.php/Cat/0/Number/470216/page//vc/1)
> e a respectiva resposta.
|
|
Date: Thu, 3 Aug 2006 16:05:17 -0400 From: "Angela To: "Ricardo Sgrillo" <sgrillo@cepec.gov.br> Subject: Re: Google Earth Question Hello Ricardo,
|
Date: Fri, 04 Aug 2006 08:36:21 -0300 To: "Angela Subject: Re: Google Earth Question about hyperlinks From: "Ricardo Sgrillo" <sgrillo@cepec.gov.br> Hi Angela, You have first to find files with the borders
coordinates. At the GE-Graph's site you will find (in the bottom)
files for France, Germany, Italy, Brazil, USA and England. There are many
other in the GE/keyhole forum, posted by Valery35. Go to
After unpack open the file with GE-Graph and assign
(or randonly generate)
Cheers Ricardo |
|
|
|
| Date: Tue, 8 Aug 2006 21:56:15 -0400
From: "Vijay To: sgrillo@cepec.gov.br Subject: GE Path question Dear Sir/Madam, I used your GE Path tool and I like it a lot.
I want to use it to show my
Thank you for putting effort into making this program. Regards,
Date: Wed, 9 Aug 2006 18:29:28 -0400
How silly of me. Thank you. It worked!
thanks again,
|
Date: Wed, 09 Aug 2006 08:55:04 -0300
To: "Vijay Subject: Re: GE Path question From: "Ricardo Sgrillo" <sgrillo@cepec.gov.br> Hi Vijay, Thanks for you email. GE-Path will draw the path
line according to the
A
If you go back from place D to the start point
A, just check "Link last to
Tell me, please, if you are succeeding now. Cheers Ricardo Sgrillo |
|
Date: Mon, 14 Aug 2006 14:02:43 +0200
Hi! I just wanted to thank you for kindly making your GEPath available on the web. I'm using it to draw long-distance training routes for my rowing machine exercises. I also would like to ask you how difficult it would be to create a live interface between a rowing machine (or exercise bike) and Google Earth? It would be absolutely great to exercise while watching my position move live on Google Earth (just like guys with GPS advices do). In this case I would draw a training path first (using GEPath, for instance), and then let the computer track my position along this path as I exercise. My rowing machine (www.concept2.com) has a usb connection and can feed information like speed and total distance into a PC, and I imagine that many exercise bikes have the same capabilities. Do you have any idea how one could create an interface with Google Earth? I have been looking at some real-time gps tracking software and I wonder if it would be smartest to write a small program that uses the rowing machine output to emulate a moving gps, i.e., using a pre-defined path together with outputs of total distance from the rowing machine to calculate lat/long coordinates. All the best,
Niclas
SWEDEN
|
Date: Mon, 14 Aug 2006 09:36:53 -0300 To: "Niclas Hjerdt" <niclas.hjerdt@emg.umu.se> Subject: Sorry,THIS is your replay GE interface with exercise machine! From: "Ricardo Sgrillo" <sgrillo@cepec.gov.br> Hi Nick, Thank you for your email. Well, I am not a GE
expert. My applications are
I suggest you goto to the GE community
Cheers Ricardo |
|
Date: Sat, 19 Aug 2006 16:46:56 +0200
Dear Grillo, Gepath is just beatufil. Trying to get my 1500 groundwater observation wells into GoogleEarth I've stumbled over a small bug which took me almost 3 hours to figure out. Others will encounter the same problem probably. Your text files need and explicit \r\n (carriage
return + line feed) and not
See attached files one with \r\n (char 13\char10)
and one with onlye \n
Regards Theo
Recardo, Thanks a lot, also for the program GE-path, it's great to see our 1590 groundwater observation wells located correctly in GE Theo
|
From: "Ricardo Sgrillo" <sgrillo@cepec.gov.br>
Hi Theo, Thank you for your email. Yes, this is a problem of VB6. It saves files
with an automatic CR at the
However there is a work around for this weakness.
You can import any file,
Hope this help you. Cheers Ricardo Sgrillo
|
|
Date: Tue, 22 Aug 2006 15:05:38 -0500
i created 2 pts, boston and washington d.c., then
derived the angle
by adding the 3rd pt at the bottom of the list
using your program,
when sending to excel it works, but to text file
it don't, nor when
test data for replication Place Latitude
Longitude Altitude
what gets filed is: dc, ,-77.009046,38.889916,0
I am able to manually edit the output your program
makes, but thought
Thanks,
- Henry
ok, seems some options may need to be set. also insert record into middle as opposed to the bottom (I can't reproduce what happened yesterday inserting at bottom but i can when inserting to middle) Hopefully fixing the one may fix the other. hopefully this will let you reproduce it. if not let me know and i will go into a step by step for it. - Henry .'.
|
Date: Wed, 23 Aug 2006 10:53:06 -0300 To: "Henry Subject: Re: GE Path 1.4.1 bug From: "Ricardo Sgrillo" <sgrillo@cepec.gov.br> Hi Henry, Thank you for your email. I am not sure if I fully understood the problem
because I was unable to
1. Create a folder in GE and create there 2 placemarks
(1-boston and
2. Save the kml file and open it with GE-Path 3. Insert a line at the bottom and type the test coordinates 4. Save as txt and click in run. It seems the program worked as expected. I am attaching the original file (Test Folder.kml),
the kml file generated
Please clarify me, if I am wrong, because I am
very interested in fixing
Regards Ricardo Sgrillo
Yes, you are right. Now I can reproduce the bug. I'll try to fix this to the next version. Thank you very much. Ricardo |
|
To: <sgrillo@cepec.gov.br>
Hallo,
Thanks for answer.
Hallo Ricardo, First of all many thanks for your quick help.
I´m working further on and
I produced two files (see attachment). One with
the shapes of the regions in
A further question: can you tell me links or sources
where I can find more
Thanks for help
|
Date: Thu, 24 Aug 2006 12:08:45 -0300
Hi Fritz Picture H was made using GE-Graph only. However
you can't work
1.Load the shape file with your borders, assign
(or generate random) a
2. Load a file with the centroid placemarks that
corresponds to each shape
(You can, naturally, choose any other graph options.) 3. In GE check all the exported files You can use this kind of procedure to generate graph for several variables. If you need further assistance let me know, please Cheers Ricardo Sgrillo
Hi Fritz, Your triangles do not appears because they are in a lower altitude then the borders. There are diferent options to fix this: 1. Choose "Flat" graph for the borders graph (as
figure H) or
You can find borders kml files, for almost the
entire world, at the GE community (http://bbs.keyhole.com/ubb/ubbthreads.php/Cat/0)
Cheers Ricardo |
|
Date: Fri, 06 Oct 2006 08:01:41 -0400 From: "Duc To: <ricardo.sgrillo@terra.com.br> Subject: GEGraph help Dear Dr. Sgrillo: I am currently working for M... as a Meteorologist. I am using the GEGraph software that you have written to do various GIS data displays. I am very impressed by its capability. Right now I am learning how to plot emission data
by various power plant
In addition, I noticed some irregularities over
the Great Lakes region,
Duc,
|
Date: Fri, 06 Oct 2006 10:38:21 -0300 To: "Duc Subject: Re: GEGraph help Hi Duc, Thank you for your email. <...but I do not know how I can incorporate
additional data into this
The expression "according to value" in the graph's
options refers to the
You can directly input your value data into the
application's table, or
<I noticed some irregularities over the Great Lakes region> Well, this is a problem with the original kml
file. It is fixed know. You
I am attaching also a txt file with correct US state borders. Please let me know if this has helped you. Cheers Ricardo Sgrillo
|
|
From: "Emil
Dear Ricardo! Thank you very much for GE graph, I find it useful displaying data regarding the tsunami recovery in Indonesia. I´ve encountered one problem though. Ive been working with 3D polygons, and by making the outlines different colors I was hoping to be able to see the need of new housing and compare it to the number of houses built so far. My problem though is that the maximun altitude of the bars is the same in both maps. This means that when overlaying the two graphs the value of 550 rebuilt houses seems to have the same value as 1880 destroyed ones. I attach the two files so can see what I mean. Ive tried to work with the Height factor but the result turns out the same. Do you have any tips on how to give value (number of houses) a fixed height (i.e. one house equals 10 metres) so that the differece becomes more visible? Thank you! Emil
Thank you very much for your help! It seems to work now and the two graphs are comparable to eachother. Another problem I had was probably a bug in my old notebook, because when I tried using my stationary computer it seemed to work out a lot better. Regards Emil |
Date: Thu, 19 Oct 2006 11:42:47 -0300"
Hi Emil, Thank you for your email. <My problem though is that the maximun altitude of the bars is the same in both "maps". This means that when overlaying the two graphs the value of 550 rebuilt house seems to have the same value as 1880 destroyed ones.> As long as your two sets (completed and needrebuilt) have the same maximum and minimum values and the "Automatic scale" is checked, the scale should be the same for each set what means that the 1880 value will be higher the 550. If you keep constant the "Height factor" and the "Altitude to add" values the height scale will be the same. If you want to make a complete set (every polygon) higher then other then enter an higher value (in meters) in the "Altitude to add" box. If you want to increase the height difference between the higher and the lower values then increase the height factor" I am attaching a kmz file with your data. Open it in GE and look carefully to the numbers and polygon's height (changing the tranparency of the higher set). You will see that the sacle is correct (you can also play with the fill color, but you will have to check the "Fix shape's draw order" option and GE will have to be in OpenGL mode). Cheers Ricardo Sgrillo
|
|
From: "Fabio
Ricardo, Gostaria de saber se a possibilidade de se usar o ge-path em forma de OCX ou ActiveX em outra aplicação Sds, Fabio
|
Date: Sat, 28 Oct 2006 11:28:41 -0300
Ola Fabio, Desculpe, mas passei a semana viajando, sem acesso a internet. Infelizmente nesta versão não tem
maneira de vc usar o GE-Path com
Abraços R. Sgrillo
|
|
To: ricardo.sgrillo@terra.com.br From: Marc H. Subject: formula in ge graph Date: Sat, 4 Nov 2006 12:05:31 +0100 . hi, I ve seen you link to GEgraph on page http://bbs.keyhole.com/ubb/
MH
|
Date: Sun, 05 Nov 2006 16:25:49 -0300 To: "Marc H Subject: Re: formula in ge graph From: "Ricardo Sgrillo" <ricardo.sgrillo@terra.com.br> Organization: CEPLAC/CEPEC Hi Marc, Most of the formulas used in GE-Graph I got from
The particular equation you are asking for is not used in the application. However I thing you can get it form http://mathforum.org/library/ Cheers Ricardo |
|
Date: Tue, 14 Nov 2006 01:54:46 -0800 (PST) From: Sai Prasanna Subject: Require Information for GEGraph To: sgrillo@cepec.gov.br Hi Sgrillo, First of
all Let me Congratulate and thanks for wonderful tools for Google Earth...Well
i am student and working on a project which is mainly integrating the application
with Google Earth...I used the logic
For example here are 2 geocoords
And your tool generated the following <lookat>.. 1) <LookAt>
I have no clue how you calculated the <range><tilt><heading> for the for multiple coordinates(for two coordinates which i mentioned above)... longitude and latitude(average of all Long and Lat). I want to know the logic behind this calculation kindly help me out with the logic behind it...This will be great help to build up the application. 2)I have some how calculated the height for the bar graph depending upon values ....but it is a constant one not like the tool of min and max. If possible kindly send how you calculated the logic for all the calculations for multiple coordinates. Kindly help me out with the detail sescription of logic behind it....Thanks for your time and effort..Hope to see your reply soon.. Regards,
|
--- "ricardo.sgrillo" <ricardo.sgrillo@terra.com.br> wrote: Hi Prasanna Thanks for your email. <LookAt>
longitude and latitude are the averages of the minimum and maximum coordinates. In your example is (9.99 + 8.64)/2 and (53.55 + 49.29)/2 range comes from empirical calculation: 1. in GE put 2 placemarks say 100 m apart. Zoom
up to a comfortable view of both placemarks and write down the distance
between the placemarks
2. repeat step 1, increasing the distance between the placemarks to 500 m, 1 km, 10 km, 100 km, 500 km, 1000 km, 5000 km, 10000 km.. 3. when you finish you will have a table with 2 variables: distance(x) and altitude (y) 4. now you have to find out an equation to describe the relation between the variables. You can try polynomial or exponential relations. In Excel this could be easily done. Find out the parameters of the equation. 5. put the equation in your application, calculate the maximum distance between placemarks and, by solving your equation, come out with the range value. in GE-Graph tilt and heading are constant for
bars graph.
<2)I have some how calculated the height for
the bar
Please reformulate this question. I am not sure
if I understand it.
Ricardo Sgrillo |
|
Date: Wed, 15 Nov 2006 02:29:13 -0800 (PST) From: Sai Prasanna Subject: Re: Require Information for GEGraph To: "ricardo.sgrillo" <ricardo.sgrillo@terra.com.br> Hi Ricardo, Thanks for
detail explanation.My second doubt was how will you calculate the height
of the bar graph depending upon the values.In your Tool the user can set
the values for the Max and Min and the height of
x=2056.8 Just want to confirm whether the method what i am following is correct(Its a constant one not like the tool).
Thanks once again for your time and replying me in detail..Sorry for disturbance
and i will get back to you if have any doubts..
Regards,
|
Date: Wed, 15 Nov 2006 09:08:21 -0300 To: "Sai Prasanna" Subject: Re: Require Information for GEGraph From: "Ricardo Sgrillo" <ricardo.sgrillo@terra.com.br> Organization: CEPLAC/CEPEC Hi Sai, Actually the min and max values the user enters
in the Color options box
Behind the calculation of the bar's height there
is the same logic used to
Thus you have to find out the maximum distance
between the bars and use
Placemark value * factor = bars height in meters Factor = f(maximum distance)/maximum Placemark value This function f can be found with the same procedure
used to find the
Cheers Ricardo |
|
Date: Thu, 23 Nov 2006 22:57:48 +0800 From: <@263.net> To: "sgrillo" <sgrillo@cepec.gov.br> Subject: the kml file can't be read by GE-Graph Hello Ricardo, Attached is a kml file of some city's border.
It could be open in Google Earth. But it can't be read by GE-Graph.
Could you tell me why?
regards,
Dear Ricardo, Really thanks for your quick help. The problem has been solved successfully after I save "Area features" as kml and open it in GE-Graph. Now I could easily use GE-Graph to meke graphs. It is a great tool. Cheers, ------------------
|
????ricardo\.sgrillo ?????2006-11-23 23:14:20 ????feifeicoolcat ???sgrillo ???Re: the kml file can't be read by GE-Graph Hi fanny, This is because you have the folder "Area feature" inside dishi.kml. 1. Open dishi.kml in Google Earth
This shall fix the problem. Feedback, please
|
|
From: "Gary S" <@surewest.net> To: <ricardo.sgrillo@terra.com.br> Subject: Quick Question Date: Tue, 28 Nov 2006 16:28:53 -0800 Mr. Sgrillo, If your path file software works you are a guiding
light from heaven. I
Gary S
From: "Gary " <@surewest.net>
Ricardo,
Gary S Air Traffic Control Consultants, Inc.
On Sat, 02 Dec 2006 14:36:13 -0300, Gary S <@surewest.net> wrote: Ricardo,
Gary S
From: "Gary S" <@surewest.net>
Ricardo,
|
To: "gshimon" <@surewest.net> Cc: "sgrillo" <sgrillo@cepec.gov.br> Sent: Thursday, November 30, 2006 8:24 PM Subject: Re:Quick Question Hi Garry, Thanks for your email. I am traveling, this week
in the country side, visiting cocoa farmers, and
GE-Path can do what you want. Send me a sample
of your data in any format (text, word table,
Regards Ricardo Sgrillo To: "Gary " <@surewest.net>
Hi Gary. I am attaching a kml file with your data. It has
three folders: one with
The coordinates and altitudes can be displayed
as you want, but the input
To draw the columns I used GE-Graph and to draw
the path line and to
Let me know if is this that you are looking for
and I will send you the
Regards Ricardo
Date: Sat, 02 Dec 2006 22:25:48 -0300
Hi Gary, <Is that opaque wall in the IMG.txt picture file available in Graph? > No, Ge-Graph is unable to draw the wall. However
I could develop a
< Do you think that is created with an overlay
in GE Earth or using some
In GE the overlaid image stays clamped to the
earth surface. If you tilt
It seems that the GE image was saved and then
the white text box was added
The procedures (see attached Excel sample): 1. Import the original data to Excel and convert
latitude and longitude to
2. To make the path line and display points name/description with GE-Path: Copy and paste in other sheet the converted data
in the following columns
Altitude(feet) - Time - Latitude - Longitude - Altitude(meters) The altitude (feet) and Time will be used as place
names and place
Copy and paste the values in GE-Path. Choose your
options for place names
3. To make the columns graph with GE-Graph. Copy
and paste the converted
Time - Latitude - Longitude - Altitude (meters) The time column is the place name and will not
be used in the final file.
Copy and paste the data in the application. Load
the option file (menu
In GE-Path erase the new "Names" folder. You can also, put all created files under the same folder. That is all. Please feedback and let me know if you need further assitance. Regards Ricardo
|
|
From: "Choi, Junsang \(Sean\)" <@lloyds.com> To: <ricardo.sgrillo@terra.com.br> Dear Ricardo, It looks very nice. But I am still trying to figure
out how to draw a
Best regards, Junsang C
De: "Choi, Junsang (Sean)"@lloyds.com
Dear Ricardo, Thank you very much. It looks great.
Best regards, Junsang Choi
|
From: ricardo.sgrillo [mailto:ricardo.sgrillo@terra.com.br] Sent: 05 December 2006 16:07 To: Choi, Junsang (Sean) Subject: Re:GEgraph Hi Jusang, Thanks for you email. < But I am still trying to figure out how to draw a circle when I only have information of one point that is center of circle. 1.In GE-Graph load your single placemark
kml file
You may also use GE-Path to draw polygons. If you have a single placemark unchek the Make Path and the Area, Perimeter options. Enter the radius lenght in "Lenght" in Make polygons box. Its unit will be the one choosed in perimeter lenght. <And I am wondering if you could let me know how to draw a band. GE-Graph doesn't draw bands. However you can draw several squares, side by side, and get a similar effect. Feedback, please
Regards Ricardo
From: ricardo.sgrillo
Hi Junsang, Well there is other way using shapefiles. It is a workaround because my applications where not projected to do this. First you have to create the placemarks for the band: 1. In GE create a folder and create all the placemarks in this folder. You have to create placemarks to delimit completely your band (or any other shape), all the way around. 2. Save the folder as kml and open it in GE-Path. Check "Remove names and icons", "Make path" and "Link last to first". Uncheck "Open in GE" click in Run and save de file, say, as prov-path.kml 3. Open the file prov-path.kml in a text editor (ASC). 4. Locate the tags <coordinates and </coordinates
and copy the numbers between they
Your shapefile should look like: [ShapeFile]
6. Copy and paste lines 2,3 and 4 bellow the 0 Now your shape file should be: [ShapeFile]
Change the second name from Band1 to Band2. Change the first lat/lon of Band2 to a different value, say adding 1. Your file should be: [ShapeFile]
7. Save the file as text. 8. Open the text file with GE-Graph 9. Check "Flat" in Graph Type and "Constant" in color. Choose your outline and fill color and click in Run. 10. In GE erase the second "+" icon in the folder Graph If you want only an outlines band (not filled)
just follows the steps 1 and 2 above.
Probably you can find less complicated ways
to make bands. I have only the free GE version.
Regards Ricardo |
|
Subject: Removing data in GE
Dear Prof. Sgrillo: I'm using GE Graph to map statistical data onto
Google Earth but am
Thanks,
Monica D
Subject: RE: Removing data in GE
Hi Sgrillo, The problem has since been solved, but I now have
another question: is
Thanks,
Subject: RE: Removing data in GE
Hi Sgrillo, Thanks for your prompt reply. Can you tell me
how to use option files, =
Thanks
|
Date: Wed, 20 Dec 2006 20:40:59 -0300 To: "Monica D-@degw.com> Subject: Re: Removing data in GE From: "Ricardo Sgrillo" <ricardo.sgrillo@terra.com.br> Hi Monica, I am not sure if I understood your question. Any
way, in Google Earth
Please, clarify me if the problem is different. Sgrillo
From: ricardo.sgrillo [mailto:ricardo.sgrillo@terra.com.br]
Hi Monica, No, the current version of GE-Graph doesn´t
support multiple datasets. However you can save your
Regards Sgrillo From: ricardo.sgrillo [mailto:ricardo.sgrillo@terra.com.br]
|