Freeware


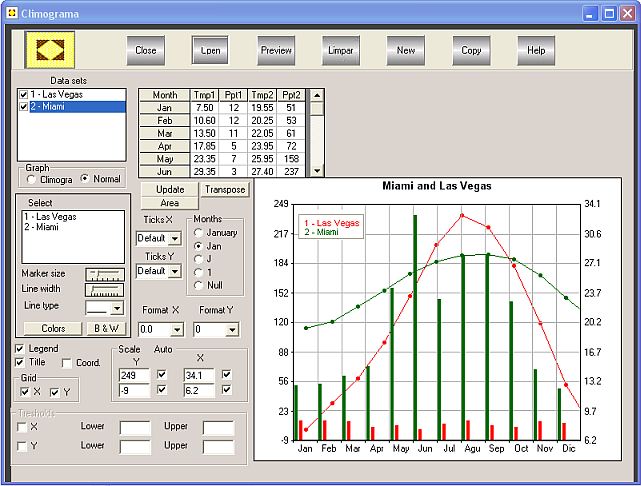
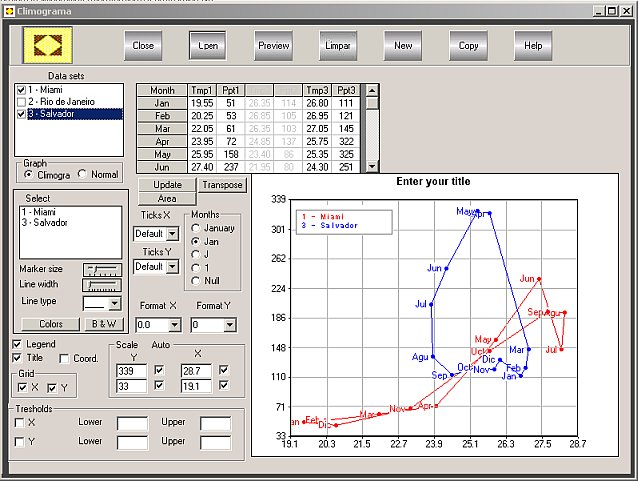
| Climogram is a classic form of representation
of the climate, what allows in a simple way, the comparison of the climatic
variation between two or more areas.
The climogram is useful to evaluate the introduction, development, adaptation, and spread possibilities for living species in the areas under study. For it construction it is plotted in the
X axis the monthly averages of one climatic variable (temperature, humidity,
precipitation, etc) and in the Y axis the monthly averages of the other
variable, joining the 12 points, forming a polygon of each area
|
|
|
Download (1.1 Mb)
(Right click and choose save target as..... or use your download manager)
Unzip de files in any directory
and run setup.exe
Download
Sample data file (4k) (If your system uses dot (.) as decimal separator)
Sample data file (4k) (If your system uses comma (,) as decimal separator)
Support from:
ricardo.sgrillo@terra.com.br
Copyrighted 2005
Ricardo
Sgrillo
Ilheus, Bahia
Copyrighted 2005
Ricardo
Sgrillo - ricardo.sgrillo@terra.com.br
Piracicaba, SP